Movement of tectonic plates results in landforms that change over time which can be represented on maps.
|
A scientist named Alfred Wegener proposed the idea that today's continents were once part of a single landmass called Pangaea that broke apart and "drifted" to their present locations.
This video explains Wegener's Theory of Continental Drift and the evidence he used to support it.
|
Evidence supporting continental drift also supports the theory of plate tectonics including fossils, climatic evidence, rock formations, matching coastlines (jigsaw puzzle), mid-ocean ridges and sea-floor spreading.
Information about the different spheres as well as the different boundaries. Tabs included underneath the video contain background info, questions, fast facts, explore more, and vocabulary.
|
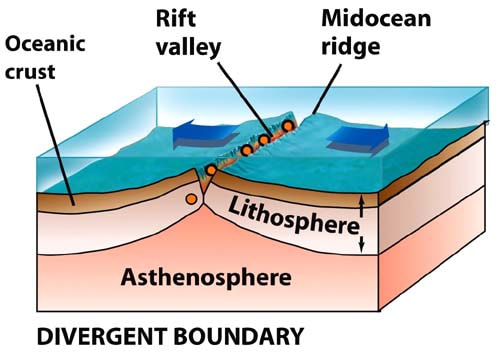
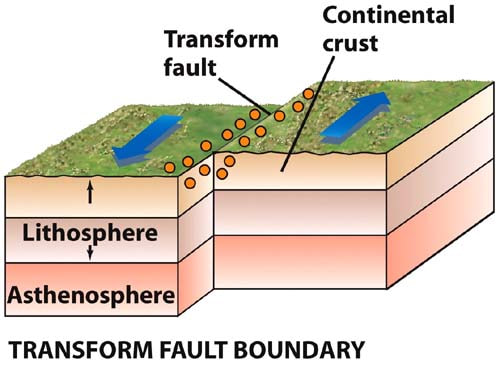
The theory of plate tectonics states that the lithosphere is made up of giant, moving slabs called plate tectonics. It identifies convection in the asthenosphere (upper mantle) as the mechanism that moves the lithosphere. Convection in the asthenosphere (upper mantle) causes tectonic plates to move. Tectonic plates consist of dense oceanic lithosphere (basalt) and less dense continental lithosphere (granite). Interaction between tectonic plates produce convergent, divergent, and transform boundaries. Different landforms are associated with different plate boundaries.
|
|
|
|
This video explains how convection causes tectonic plates to move.
|
This video explains how convection causes tectonic plates to move as well as examples of convergent, divergent, and transform plate boundaries.
|
Types of plate boundaries:
Satellite views are photographic images of the Earth's surface. Satellite images of the same area taken at different times can show changes due to weathering, erosion, deposition of land features such as canyons, deltas, and mountains.
|
The video gives real world examples of how the Hydrosphere and Geosphere affect each other in the form of weather and erosion.
|
The is a video of a sandbox equipped with a Kinect 3D camera and a projector to project a real-time colored topographic map with contour lines onto the sand surface. Only visual, no sound.
|
Can we predict the effects of weathering and erosion of a land feature with or without vegetation?
Topographic maps use contour lines to show elevations along the surface of the Earth. Contour lines connect points along a single elevation. Contour lines that are close together indicate steepness of slope.
|
|
|
|
This video explains what topography is and how we use it to study the Earth.
|
This video gives detailed explanation as to how to read a topographic map. Section 5 explains how to calculate the gradient of a particular slope. TEKS require students to be able to calculate the change in elevation. Concludes with a demonstration of how to determine the landform's profile from a contour map.
|
